Looking for a free technical analysis software? We may help you with one, that supports commodities, currencies and stocks from any countries, and works on mobile devices, too!
How does it support technical analysis?

Chartoasis Chili supports the essential technical analysis functions, like
- on the main chart:
- you can choose from chart types like candlestick, area or line chart
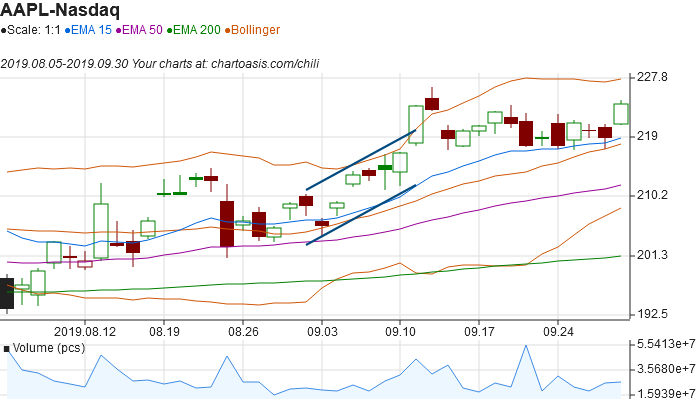
- 3 line charts of moving averages (15, 50, 200 days EMA by default) and Bollinger bands (with parameters 20,2 by default)
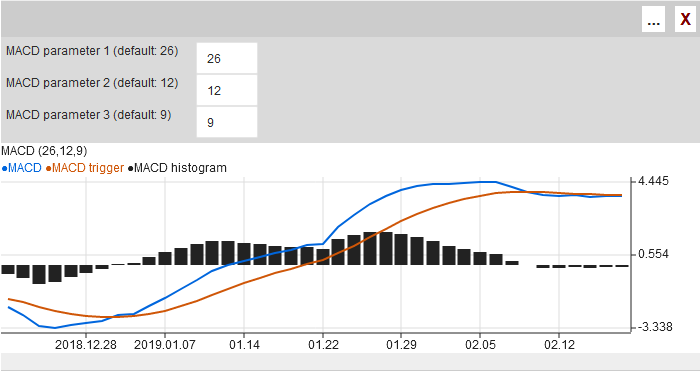
- the best known technical indicators are available in separate charts, like MACD, RSI, OBV, Accumulation/Distribution and Stochastic Oscillator
- You can draw channels, wedges, and add markings to the charts if you recognize a pattern on the chart.
- all parameters of moving averages, Bollinger bands and other indicators are customizable to be able to fine tune them to your equity

Note: any changes made to the application can be saved to your browser.
What can it be used for?
Market data
May sound obvious, but one needs data for analysis, which may come from various sources.
We wanted to make this software as flexible as possible. It contains built-in data for currencies, on the other hand its biggest advantage is, that it is not limited to built-in data but it can handle almost any market data that can be downloaded.
So it works with:
- built-in currency data
- from files that are downloaded separately or fed through a URL:
- currency data
- stock data from almost any country
- supported countries are eg.: Australia, Austria, Belgium, Canada, China, Denmark, France, Germany, Hong-Kong, Hungary, India, Indonesia, Israel, Italy, Japan, Netherlands, Norway, Poland, Portugal, Russia, South Korea, Spain, Sweden, Switzerland, Taiwan, United Kingdom, USA
- commodity data
We have a collection of free market data sources here.
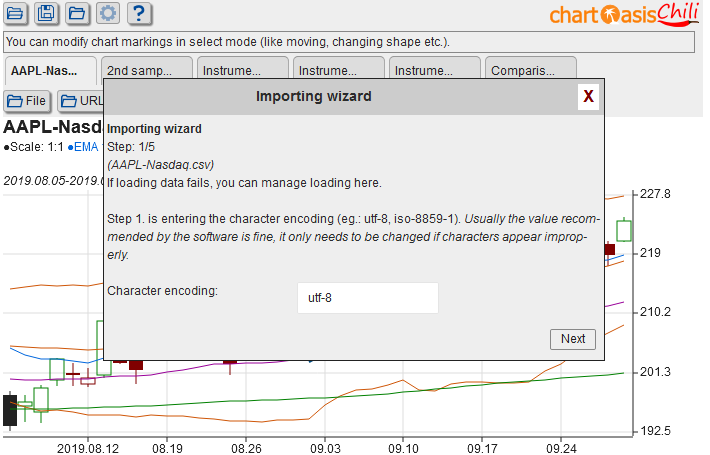
Chartoasis Chili contains a software module that attempts to recognize data formats autaomatically. If it fails doing so, it will pop up the “Importing wizard“, which will help you to import data manually. (You can also invoke it manually, when data seem to be imported improperly.)

Note: you can load 5 datasets simultaneously.
Requirements
This technical analysis software runs in a browser (like Google Chrome and FireFox). This means that it works on Windows, Macintosh and Linux, too.
It works even on mobile devices, both on Android and iOS – however you may have to use Google Chrome on iOS instead of Safari. (When started on a small screen device, it will load a mobile optimized version automatically).
Some users reported, that it works surprisingly fast on a mobile phone, so the hardware requirements are quite low.
Is it really free?
There are lots of situations when someone can not afford expensive softwares for technical analysis. Not only when the budget is low, but eg.: when someone executes only a few transactions in a year, or being in the learning phase, or when looking for figures for a thesis work… And Chartoasis Chili‘s basic version may help everyone in these situations.
Browsing similar softwares you can find different levels of “free softwares”, eg.: free trial, free if you use the trading platform, free if you register…
To make things clear, this applies to Chartoasis Chili’s basic version:
- it can be used free of charge as long as you want
- there will be features that will be available in premium versions only, but none of the free version’s features will be moved to the premium version
- using it requires no registration
- advertisements may appear
- the entire software is copyrighted to Chartoasis Limited company / Tőzsdeász Kft.
- charts created with Chartoasis Chili’s free version shall be shared under Creative Commons Attribution 4.0 International License.
Try it now for free!
It takes only 1 click, and you can try Chartoasis Chili!
It loads sample data right at the beginning, so you can try any feature right now.
>> I want to try Chartoasis Chili! <<
(Note: you can switch to candlestick chart with a button below the main chart.)