Looking for the best stock analysis software? Let’s see the aspects of stock analysis which may be important before finding the best one!
General features
Before going into details, we may have to discuss a couple things about stock analysis softwares in general.
- platform: to use a software you must know whether it will run on your device. Does the software run on the operating system you use, or is it running in a browser (which is more or less platform independent)? Does it work on Android or iOS, if you want to use it in a mobile environment?
- price: there are free softwares, there are ones with monthly / annual subscriptions and with one-time fees. You must know which one you can afford.
- supported countries: if you can not use the software for the desired stocks, it is obviously a blocker issue, regarless how perfect the software is.
- support: what level of support can you expect, if you have a problem, and how can you contact support?
- trading interface: can you also place orders in the chart application?
Technical analysis
Lots of traders use the tools of technical analysis. If you are one of them, you will find important the following things:
- How many indicators are supported? Can you fine tune idicator parameters?
- Does the software recognize chart patterns (like expanding triangle etc.) automatically?
- Is the any “scripting” option, to create your own buy and sell signals, maybe automated trades?
- Does the software support backtesting of a strategy?
Fundamental analysis
Fundamental analysis is a complex thing, and software can only offer partial support.
However, here are some tangible parts of fundamental analysis, which can be supported by softwares, too:
- Does the software / platform provide fundamental KPIs like P/E, book value, sales etc.?
- Does the software / platform provide / highlight dividend informations, or provide stock prices adjusted for dividends? (note: technical indicators may show false results when dividends are paid)
- Does the software / platform provide you with news related to the stock?
Market analysis
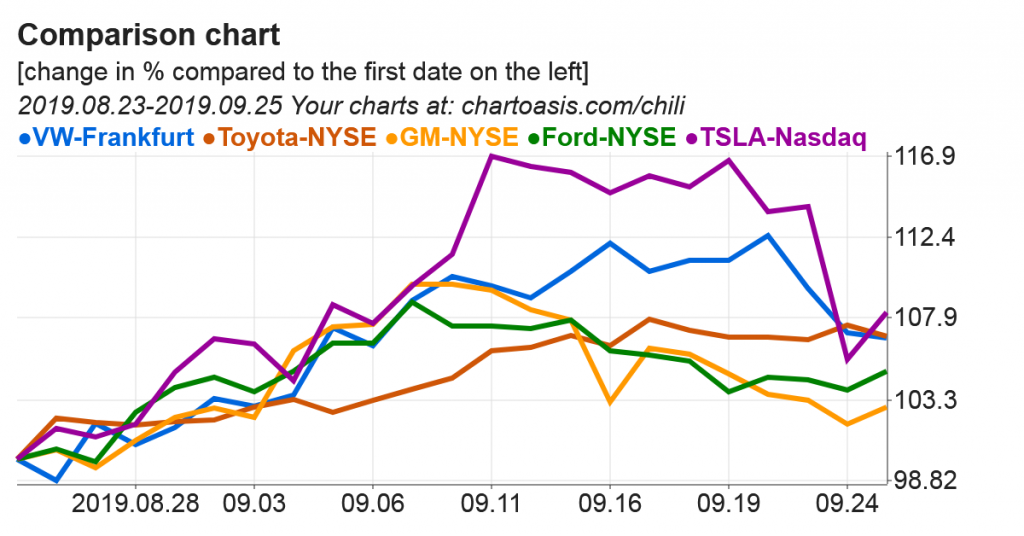
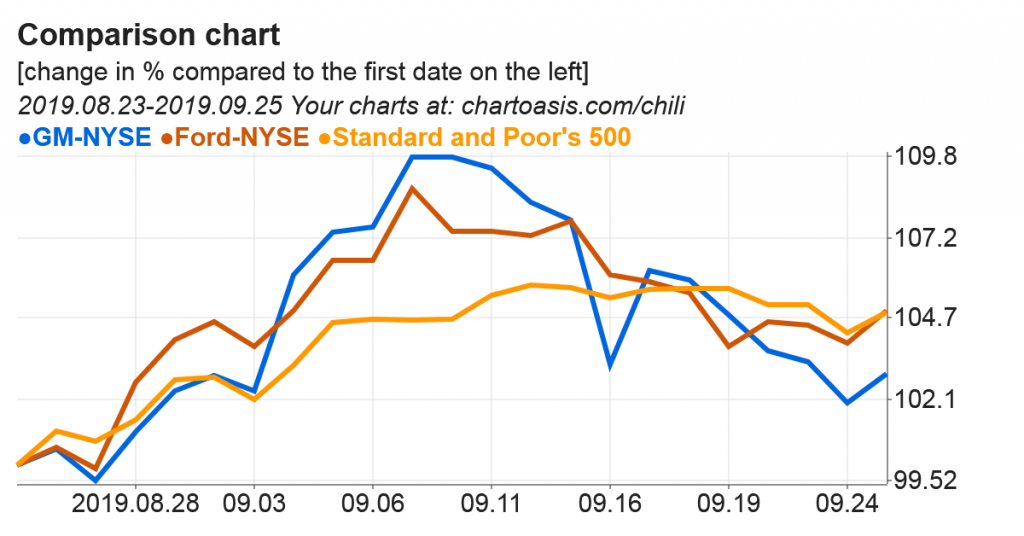
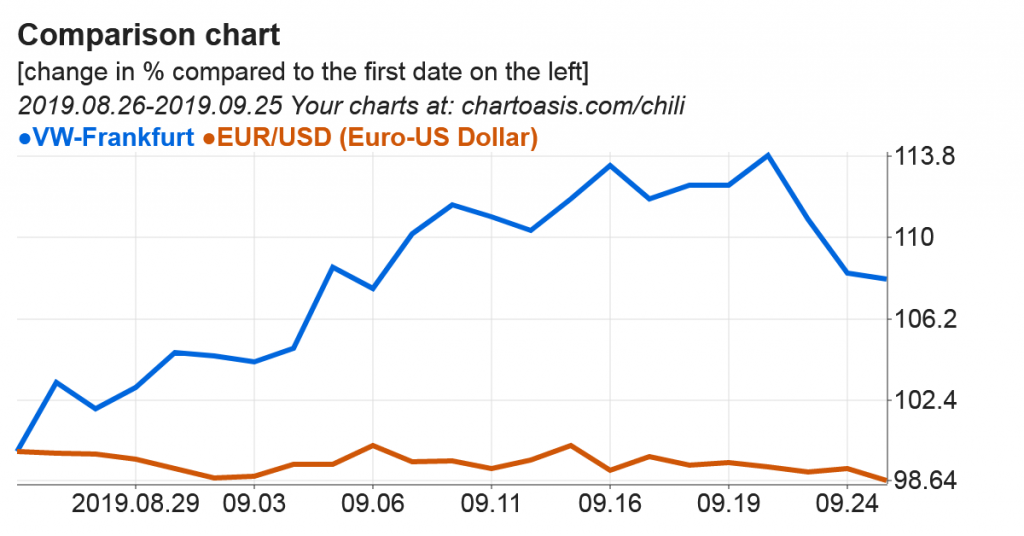
As a part of analysis, it may be interesting to see, how our stock performs in a broader context, like
- Does the whole industry behave the same?
- Is the whole market behaving the same? Is the stock moving as same as the related stock index?
- If the stock is from a foreign country, how is the currency rate changing?
For example, to highlight such things, you can observe the relative change in a given time frame:


And the best one is…
The best one for you depends on your current situation, like your budget, the way you are investing (from daytrading to value investor), your experience etc.
- Going through above features may help to decide which features are important, and which are not.
- After having the important features you can decide if a stock analysis software may fit your needs, or not.
- If there are some good candidates, after some testing you may have the final decision.
We would not tell you about the capabilities of any softwares, because that may become obsolote or may skip existing features, that might be important for you. However, as a starting point, we would suggest to check TradingView, Worden TC2000, eSignal, NinjaTrader and our free stock analysis software, Chartoasis Chili.